A few months ago, Amazon recommended that I read Postwar. It is an incredible book, but it’s so long and contains so much information I had forgotten almost everything by the time I finished.
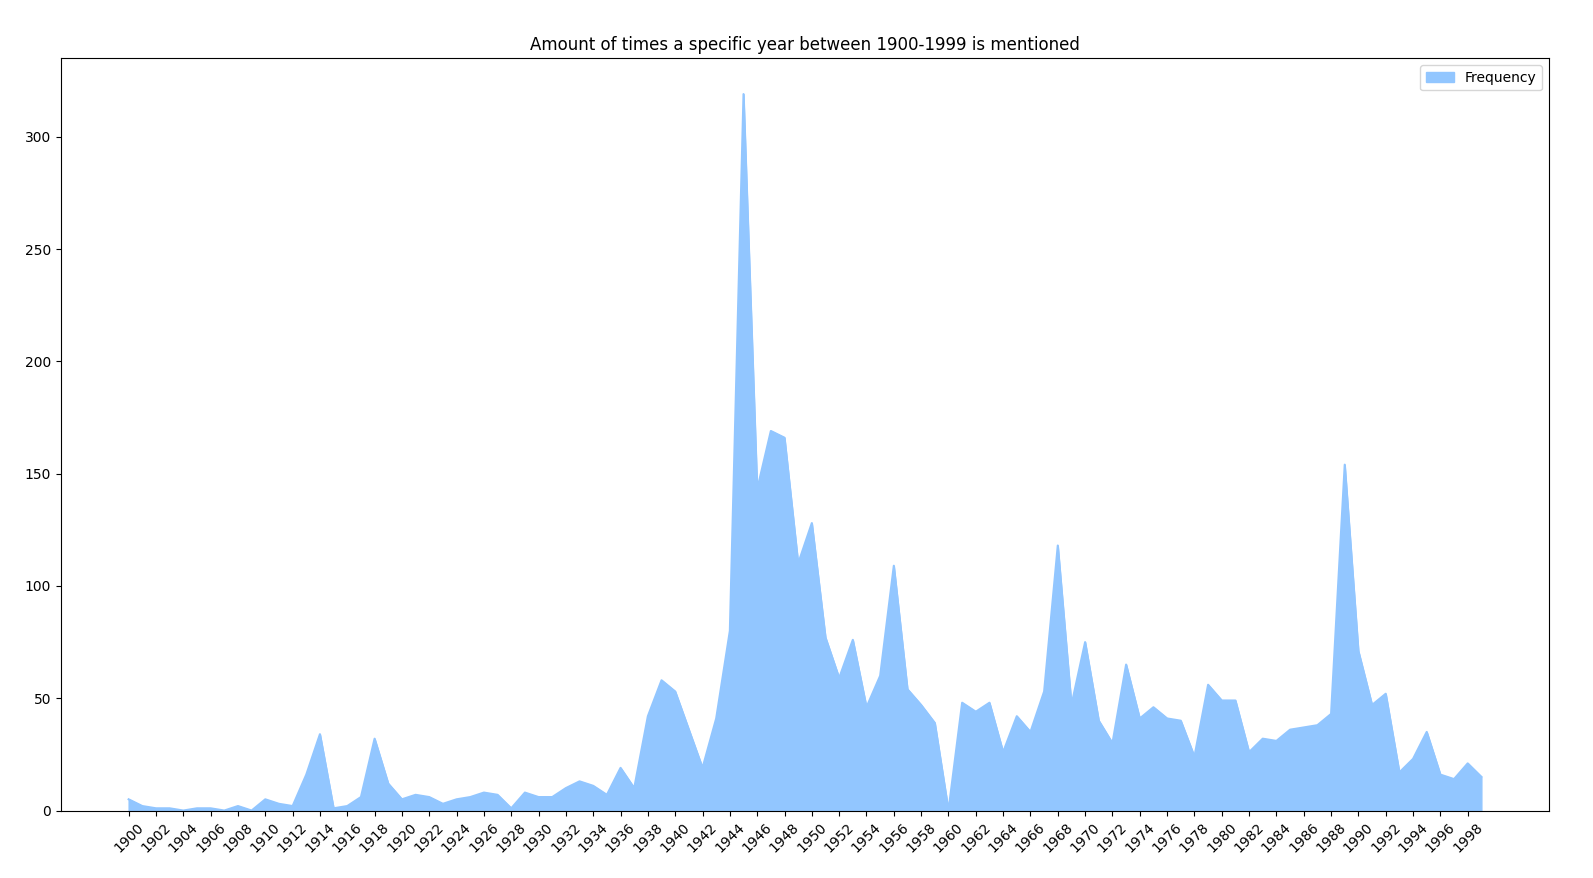
Therefore I wanted to see if I could write code to help review the book. I especially wanted to understand what years and events would be worth remembering. As a proxy for importance, I therefore extracted the frequency each year is mentioned:

One interesting takeaway is that 1960 is the only year after 1945 that’s never mentioned. I tried to confirm if this is random or not through Google Ngram searches. Of the three years 1959-1961, 1960 seems to be mentioned the least often (though it is pretty close). So it might be that 1960 is the most uneventful year in European post-war history ?
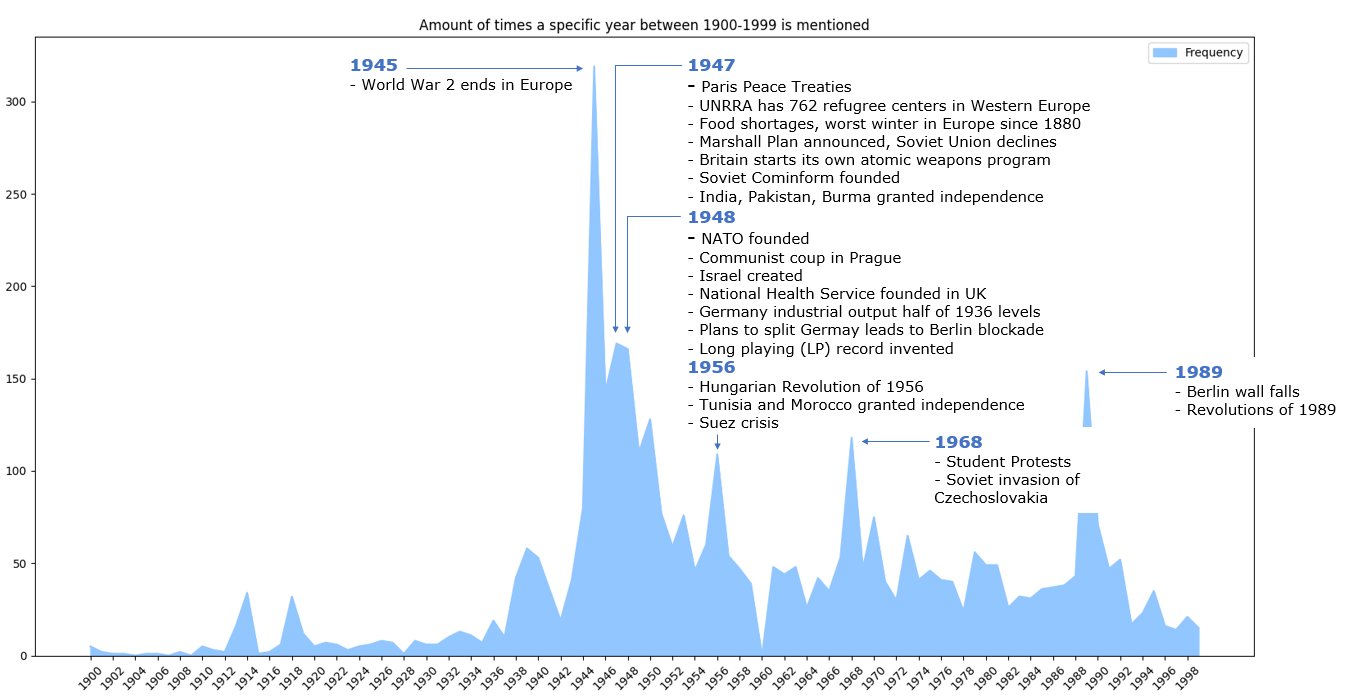
I then reviewed the book by reading the sentences that contains the most frequently mentioned years. Here’s an annotated version of the graph above showing some of the key events:

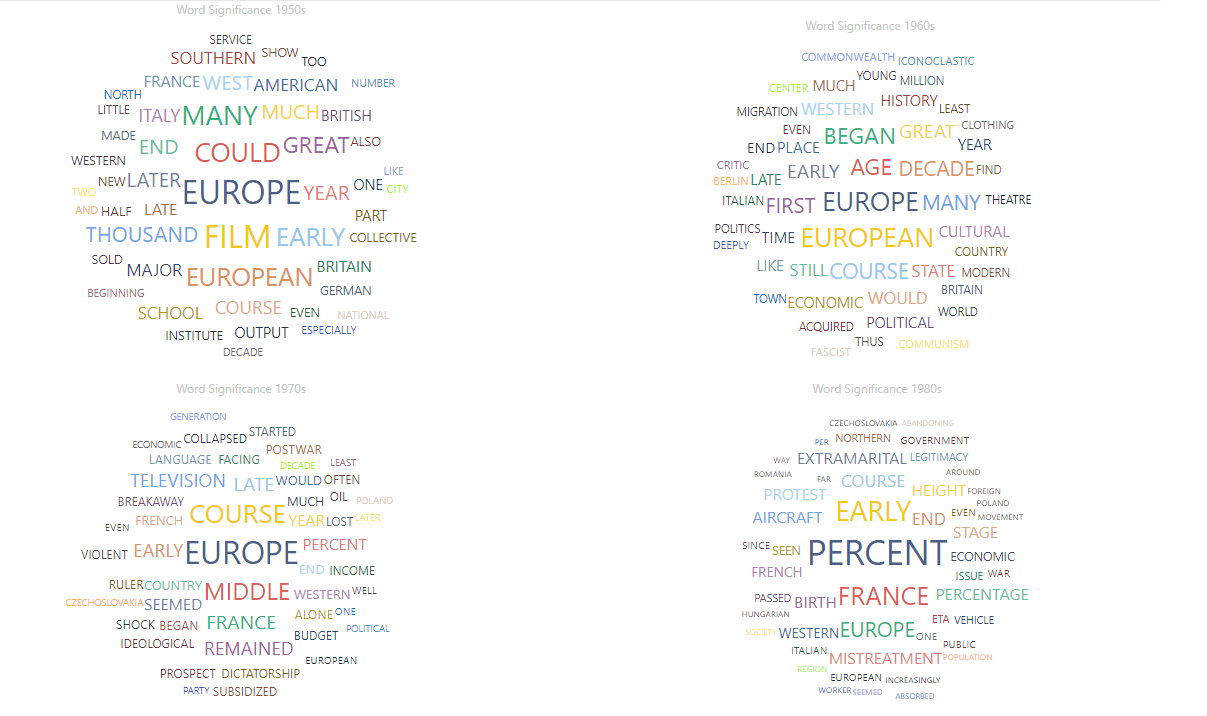
I also wanted to summarize broad themes from the post-war decades 1950-1980. To do that I wrote another script to extract each sentence which referenced a decade, e.g. containing “1950s”. I then used Term Frequency-Inverse Document Frequency (TF-IDF) to identify word significance. I visualized the output in Power BI so that word size is determined by TF-IDF.

Unfortunately the word significance was not very informative. There are some insights, for instance an important word of the 1950:s is “Film”. Cinema attendance was on it’s way down due to the introduction of the TV, but the average person in the UK still went to the cinema 28 times per year, 40% more than before the war.
But since there are relatively few sentences per decade, a few sentences can heavily skew the results. For instance the top word for the 1980:s is “percent” due to sentences like this:
“…the [French Communist] Party saw its share of the vote fall steadily at every election: from a post-war peak of 28 percent in 1946 to 18.6 percent in 1977 and thence, in a vertiginous collapse, to under 10 percent in the elections of the 1980s”
Overall this was an interesting experiment in trying to make it easier to remember key points from a book. All code can be found on Github here.